Table of Contents >> Show >> Hide
- What Is a Phased Array Antenna System?
- The Hackaday Visualization: Turning RF into a Light Show
- How Beamforming and Beam Steering Actually Work
- Where You Meet Phased Arrays in Real Life
- Visualizing Phased Arrays Beyond the Hackaday Demo
- Why Visualization Is So Powerful for Learning Phased Arrays
- Getting Hands-On: How to Explore Phased Arrays Yourself
- Hands-On Experiences with Phased Array Visualization
- Conclusion: From Rainbow Panels to Real-World Systems
If you’ve ever stared at the forest of antennas on a warship, a weather radar dish, or even the weird little sticks on a 5G base station and wondered,
“How does that know where to point without moving?”, welcome to the world of phased array antenna systems. They’re the quiet overachievers behind modern radar, satellite links, and high-speed wireless and thanks to a brilliant demo featured on Hackaday, they’re also surprisingly beautiful to look at.
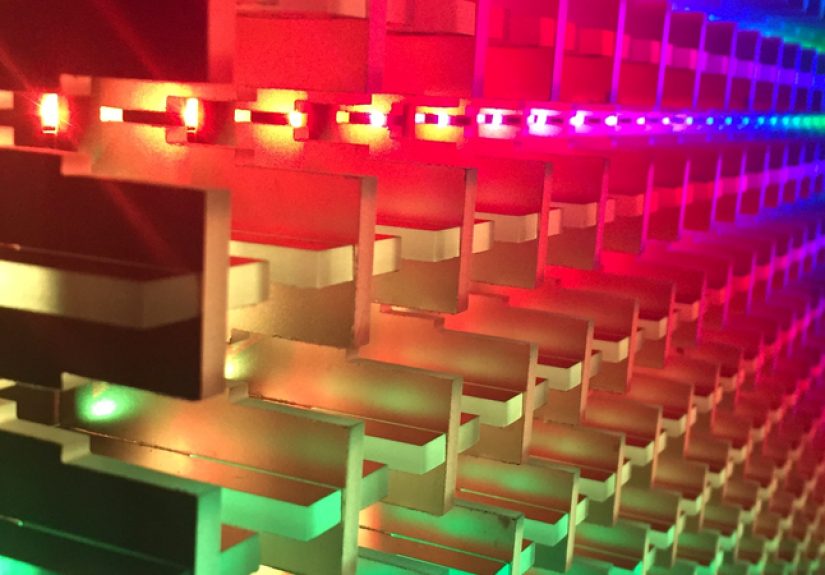
In that project, a team at MIT Lincoln Laboratory used a wall of 1,024 RGB LEDs to turn invisible radio waves into light. Each LED represents an individual antenna element. Change the phase and amplitude of the RF signal feeding that element, and the LED’s color and brightness change right along with it. What’s usually locked away in math and Maxwell’s equations suddenly becomes a rainbow you can literally point at with a joystick.
In this guide, we’ll unpack what a phased array antenna system actually is, why visualization tools like the Hackaday LED wall are such game-changers for learning, and how you can start exploring phased arrays yourself even if you don’t currently own a destroyer or a giant radar dome.
What Is a Phased Array Antenna System?
A phased array antenna system is basically a team sport for antennas. Instead of a single big dish, you line up many smaller antenna elements (think patches, dipoles, or slots) and drive each one with the same signal frequency but with carefully controlled phase and amplitude. When those signals radiate out into space, they add up: in some directions they reinforce one another (constructive interference), and in others they cancel (destructive interference).
The resulting pattern has a strong main lobe a directional beam where most of the power goes plus weaker side lobes and nulls. By tweaking the phase of each element, you can electronically steer that main lobe without physically moving the array. That’s the essence of beamforming and beam steering.
A few key ideas define phased array systems:
- Antenna elements: Individual radiators (for example, microstrip patches or printed dipoles) arranged in a line (1D array) or grid (2D array).
- Phase shifters or time delays: Circuits that advance or delay the RF signal at each element so that the waves line up in the desired direction.
- Amplitude control (tapering): Adjusting element power levels to suppress side lobes or shape the beam.
- Control system: DSPs, FPGAs, or dedicated beamforming ICs that compute and apply the phase and amplitude settings in real time.
Put all of that together and you get an antenna that can look in different directions, track moving targets, or serve multiple users in different spatial beams all without any motors, gears, or squeaky bearings.
The Hackaday Visualization: Turning RF into a Light Show
The Hackaday-featured demo takes a real phased array that MIT Lincoln Laboratory built and replaces its RF hardware with a transparent plexiglass clone stuffed full of NeoPixel LEDs. Behind the scenes, a computer computes the phase and amplitude that each antenna element would need to form a particular beam pattern. Instead of driving RF, it drives light:
- Each antenna element → two LEDs: One LED for each polarization (horizontal and vertical), reflecting a dual-polarized phased array.
- LED color → phase: Hue maps to phase angle. As you change the beam direction, the colors swirl across the panel like a moving interference pattern.
- LED brightness → power: Elements contributing more power to the beam glow brighter, making tapering and side-lobe control visually obvious.
- Joystick control: Move the joystick and the beam direction changes. The LED colors and brightness reconfigure in real time, while a nearby monitor plots the far-field radiation pattern.
It’s basically “RF with training wheels.” Instead of staring at equations or static plots, you get instant visual feedback: push the beam up, the color gradient tilts; narrow the beam, the central region brightens while more elements participate with smoothly varying phase.
For students and engineers, this demo compresses years of abstract electromagnetic theory into a few minutes of “Ohhh, so that’s what phase does.”
How Beamforming and Beam Steering Actually Work
Under the hood, beamforming is all about controlling the array factor the way individual antenna patterns combine when spaced apart and driven with different phases. Imagine a simple 1D array of identical antennas spaced in a line:
- The elements are separated by distance d.
- The signal wavelength is λ.
- You want the main beam to point at some angle θ off broadside.
If you feed each element with a phase shift Δφ relative to its neighbor, the waves add constructively in the direction where the path length difference matches that phase shift. Roughly speaking, you choose Δφ so that:
Δφ ≈ −(2πd / λ) · sin(θ)
Change Δφ and the direction of constructive interference the main beam swings around like a flashlight in the sky. A linear array can steer in one plane; a 2D grid can steer in azimuth and elevation.
Real systems get more sophisticated:
- Amplitude tapering: By reducing the amplitude at outer elements, you can dramatically lower side lobes (at the cost of widening the main beam).
- Multiple beams: With digital beamforming, you can create several simultaneous beams from the same array think one radar aperture tracking multiple targets or a base station talking to different users at once.
- Time-delay beamforming: At very wide bandwidths, true time delays are used instead of simple phase shifts to avoid beam squint across frequency.
The Hackaday visualization doesn’t force you to derive all this on paper. You can literally see side-lobe levels change as the LED brightness taper is adjusted, and you can watch the main beam sweep as the phase gradient across the panel increases.
Where You Meet Phased Arrays in Real Life
Phased array antennas might feel exotic, but they already touch everyday life:
- Radar systems: Airborne early-warning radars, missile defense systems, and shipborne arrays use electronically steered beams to sweep the sky quickly and track multiple targets without moving massive dishes.
- 5G and beyond: Millimeter-wave 5G base stations lean on phased arrays to focus energy toward your phone, overcoming the high path loss at 24–40 GHz and beyond.
- Wi-Fi and MIMO routers: Multi-antenna systems use related beamforming concepts to improve throughput and reliability, even if they’re not full military-grade phased arrays.
- Satellites and flat-panel terminals: Electronically steered arrays allow user terminals on moving vehicles to track satellites without gimbals or domes.
- Medical and industrial imaging: Ultrasound scanners and some sonar arrays use phased-array principles to steer acoustic beams inside the body or under the sea.
In all of these cases, the same basic trick is happening: many small radiators, carefully choreographed in phase and amplitude, acting like a single smart antenna that can look wherever the system needs it to.
Visualizing Phased Arrays Beyond the Hackaday Demo
The LED wall is eye-candy, but there’s a whole ecosystem of visualization tools that let you experiment with phased arrays without soldering thousands of LEDs:
- Browser-based visualizers: Online demos let you drag sliders for element spacing, beam angle, and taper and then update the radiation pattern in real time. You can see how grating lobes pop up when spacing exceeds half a wavelength and how taper shapes the sidelobe floor.
- Simulation toolboxes: Packages in MATLAB, Python, and other environments provide array geometry builders, beamforming routines, and 2D/3D pattern plots. They’re ideal for exploring “what if” scenarios for different frequencies and layouts.
- Full-wave EM solvers: COMSOL, CST, HFSS, and similar tools simulate not just the array factor but the detailed fields around complex geometries, including mutual coupling and dielectrics. Their visualizations show beams emerging from real-world hardware models.
- Open-source projects: Community tools and GitHub projects provide interactive array animations you can run locally or in the browser, often with simple GUIs tailored for teaching.
What all these tools share with the Hackaday visualization is the idea that seeing the beam matters. When you watch the main lobe tilt as phase offsets change, “phased array” stops being a buzzword and starts feeling like a physical thing you can reason about.
Why Visualization Is So Powerful for Learning Phased Arrays
Phased array theory is notorious for losing people somewhere between “array factor” and “mutual coupling.” Visualization bridges that gap:
- It connects math to intuition. Seeing LED colors flow from a smooth gradient (well-behaved main lobe) to a jagged mess (high sidelobes and grating lobes) helps students understand what those Fourier-ish equations are really describing.
- It highlights trade-offs. Widening the beam to cover more sky means lower directivity. Aggressive tapering drops sidelobes but costs peak gain. Visual tools make these trade-offs obvious.
- It accelerates debugging. For practicing engineers, visualizing excitation patterns and far-field beams can quickly reveal issues like mis-wired elements, wrong spacing, or unexpected coupling.
- It’s engaging. Let’s be honest: watching a rainbow LED wall steer an invisible microwave beam around the room is simply more fun than paging through a 200-page textbook.
No surprise that phased array visualizers are showing up in university labs, conference demos, and even maker projects. Once you can see the beam, it’s hard to go back.
Getting Hands-On: How to Explore Phased Arrays Yourself
Maybe you don’t have the budget for 1,024 LEDs and a microwave lab, but you can still get surprisingly far:
1. Start in Software
Download or code a simple phased array simulator. Begin with a 1D linear array, set the spacing to half a wavelength, and plot the array factor for different steering angles. Add a second dimension later.
- Experiment with different element counts (8, 16, 64) and see how the beamwidth shrinks as you add more elements.
- Try uniform amplitude vs. tapered amplitude (for example, cosine or Taylor taper) and compare sidelobe levels.
- Push the spacing beyond 0.5λ and watch grating lobes appear like ghost beams at other angles.
This is where the Hackaday visualization concept shines: the same changes that move colors across the LED panel are precisely the changes you’re plotting in your simulator.
2. Move to Hardware (Carefully)
If you’re comfortable with RF, you can experiment with small arrays at lower frequencies (think VHF/UHF) or around Wi-Fi bands:
- Use off-the-shelf patch array boards or design a simple 4–8 element microstrip array on FR-4.
- Drive the elements with phase-adjustable RF sources or a phased array development kit.
- Scan the field pattern in a makeshift test range (or at least measure relative levels at a few points) as you change phase offsets.
You don’t need military-grade hardware to see beam steering in action, but you do need to follow RF safety and regulatory rules. High-power experiments, especially at microwave frequencies, should be handled with care and within local spectrum regulations.
3. Add Your Own Visualization Layer
You might not recreate the full MIT LED wall, but you can imitate the concept:
- Map your simulator’s phase values to color and draw a 2D grid on-screen.
- Animate beam steering so that the color pattern moves as you drag a slider or joystick.
- Display the corresponding far-field polar plot alongside the element-phase visualization.
Now you’ve basically built a software cousin of the Hackaday demo one you can tweak, extend, and share.
Hands-On Experiences with Phased Array Visualization
Talk to engineers who work with phased arrays and you’ll hear a similar story: the first time they really “got it” wasn’t when they finished a homework set it was when they saw the beam move.
In many university labs, students start with a simple linear array driven from a vector signal generator and a multi-channel phase shifter. On a screen, they plot the far-field pattern as they adjust the phase on one control channel. The first twist of a knob barely nudges the beam; the second twist sends it marching across the polar plot. Side lobes rise and fall. Someone inevitably mutters, “Whoa, that’s actually pretty cool,” usually right before they try to break the lab’s carefully tuned taper.
Visualization also transforms system-level troubleshooting. Consider a small radar lab setup where a phased array front end feeds a digital backend for range–Doppler processing. If the array calibration drifts, targets smear or vanish. Instead of combing blindly through logs, teams overlay a visualization of the current element phases and amplitudes. A single misconfigured RF chain stands out as a stripe of wrong color or brightness, instantly narrowing the search. What could have been a multi-day debugging marathon becomes an afternoon fix.
Makers and hobbyists have their own flavor of experience. Inspired by demos like the Hackaday LED wall, they’ll build small LED panels tied to microcontrollers that mirror the excitation of a toy antenna array or even a pure simulation running on a laptop. At a glance, you can tell when the array is forming a clean, narrow beam, or when sidelobes are out of control. Show this to a non-engineer and they may not know what “array factor” means, but they absolutely understand that the tidy rainbow pattern is “good behavior” and the chaotic twinkling is “something went wrong.”
Visualization also helps bridge different domains. Acoustic labs, for example, use phased microphone arrays to locate sound sources in a room. When you display both the acoustic beam pattern and an equivalent RF phased array pattern, students begin to see that these aren’t isolated specialties. The same beamforming mathematics powers ultrasound imaging, sonar, radar, satellite links, and that flashy LED panel from Hackaday. Once that connection clicks, it becomes much easier to move between fields and reuse intuition.
Perhaps the most powerful experience comes when learners are given a way to poke the system in real time. A joystick or gamepad tied to the beam-steering controller invites exploration. “What happens if I steer beyond 45 degrees?” “Why does the beam break into two?” “Why do colors wrap around at certain phase values?” Every one of those questions is a teachable moment wrapped in a visual puzzle. The demo stops being a static exhibit and becomes a conversation between the user, the hardware, and the underlying physics.
That’s the real magic of visualization of a phased array antenna system. It doesn’t just show you that beamforming works; it invites you to play with it. And in RF, as in most things, play is often where the deepest understanding comes from.
Conclusion: From Rainbow Panels to Real-World Systems
Phased array antenna systems sit at the intersection of electromagnetics, signal processing, and practical RF engineering. They enable radar to scan the sky without moving, 5G cells to focus energy onto your phone, and satellites to track users without mechanical gimbals. But until you can see how phase and amplitude weave together across an array of elements, it’s easy for the topic to feel abstract and intimidating.
The Hackaday-highlighted LED visualization cuts straight through that barrier. By mapping phase to color and power to brightness across a grid of LEDs, it turns invisible microwave behavior into something you can literally watch and steer. Combined with software simulators, full-wave EM tools, and hands-on lab experiments, it forms a powerful toolkit for anyone wanting to understand or design phased array systems.
Whether you’re an RF engineer, a student, or just a curious hacker, spending time with phased array visualizations is one of the fastest ways to build solid intuition. And once you’ve watched a beam swing across a virtual sky because of a few carefully chosen phase shifts, you’ll never look at that weird flat radar panel or 5G antenna the same way again.
SEO metadata in JSON format