Table of Contents >> Show >> Hide
- Before You Teach: The Big Idea Students Need
- Method 1: Make “Per 100” Visible With a 10×10 Grid
- Method 2: Teach the “Percent Bridge” (Fraction ↔ Decimal ↔ Percent)
- Method 3: Teach Percent Through Real Life (a.k.a. Percent in the Wild)
- Quick Checks: Are Students Understanding or Just Doing Tricks?
- Common Misconceptions (and One-Liners That Help)
- Experience Notes From Real Classrooms (About )
Percentages are the Swiss Army knife of math: they slice through discounts, sprinkle onto test scores, and somehow end up
on every sports graphic ever made. The only problem? For a lot of students, percent feels like “that symbol we slap on a
number when adults talk about shopping.”
The good news is that percentages are actually one of the most teachable ideas in middle school mathif we introduce them
as meaning, not just a formula. This guide breaks percent down into three easy, classroom-friendly methods that build
real understanding: (1) make “per 100” visible, (2) connect percent to fractions and decimals, and (3) practice with
real-life situations students already care about (yes, even fast food combos and phone battery icons).
Before You Teach: The Big Idea Students Need
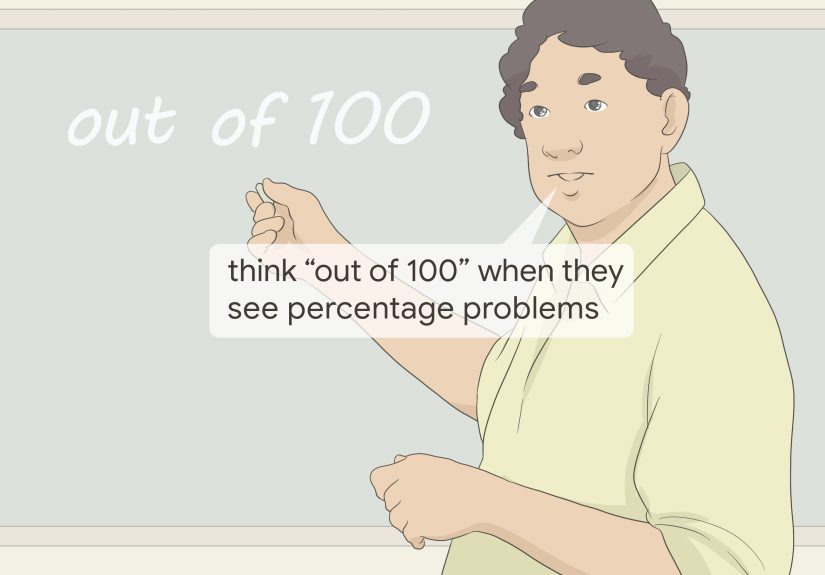
A percent is a rate “out of 100.” That’s it. Not “move the decimal,” not “multiply by something,” not “panic quietly.”
Percent is a way to describe how much of something you have compared to 100 equal parts.
Once students own that meaning, the procedures become reasonable. They can explain why 25% is the same as 25 out of 100,
why 0.25 shows up, why 1/4 is involved, and why 150% can exist without the universe collapsing.
Method 1: Make “Per 100” Visible With a 10×10 Grid
If percent means “per 100,” then your first best friend is a model that literally has 100 parts. Enter: the 10×10 grid
(also called a hundred grid). It’s simple, visual, and surprisingly powerfullike duct tape, but for math.
Step 1: Start With Shading, Not Solving
Give students a blank 10×10 grid and ask:
“Shade 20%.” Don’t allow calculators. Don’t mention decimals. Let the model do the talking.
- Each small square = 1%
- One full row (or column) of 10 squares = 10%
- The whole grid = 100%
Then flip it:
“Here’s a shaded gridwhat percent is shaded?”
Students can count squares or count rows/partial rows. This builds the key habit: percent is a quantity you can see.
Step 2: Teach Benchmark Percents Like They’re VIPs
Students don’t need to memorize 73 different tricks. They need a small set of benchmarks they can reason from:
1%, 10%, 25%, 50%, 75%, and 100%.
Use the grid to build these benchmarks:
- 10% = 1 row shaded (10 squares)
- 50% = half the grid (50 squares)
- 25% = one quarter of the grid (25 squares)
- 1% = one square (useful for “tiny” reasoning)
Once benchmarks are automatic, students can find more complex percents by combining them:
35% = 30% + 5%, 62% = 50% + 10% + 2%.
Step 3: Go Over 100% (Calmly) Using Two Grids
Many students secretly believe 100% is the biggest number a percent can be. Show them it’s just a comparison to 100,
not a speed limit.
Example:
109% means 109 out of 100. Shade one full grid (100%), then shade 9 squares on a second grid.
Now 109% looks totally normal, like it pays rent and owns a toaster.
Try It Tomorrow: Three Quick Activities
-
Percent Relay (5 minutes): Put 6 grids on the board with different shading. Students rotate and write
the percent for each one. Keep it fast, low-stakes, and loud in a good way. -
Build-a-Percent (7 minutes): Call out numbers (e.g., 47%, 80%, 12%). Students shade on mini-grids.
Then students trade papers and check each other. -
Spot the Benchmark (5 minutes): Show 58% and ask, “What benchmark is it closest to: 50% or 75%?
How do you know?” Students explain, not just answer.
Common Hiccups (and Fixes That Don’t Require a Sermon)
-
Hiccup: Students count rows wrong.
Fix: Label rows as 10%, 20%, 30%… right on the side of the grid. -
Hiccup: Students confuse “percent shaded” with “percent unshaded.”
Fix: Ask, “Does your answer make sense? If 80 squares are shaded, should the percent be bigger or smaller than 50?” -
Hiccup: Students think 0% means “nothing exists.”
Fix: Use real examples: “0% chance of snow” is still a weather forecast, not a universe reboot.
Method 2: Teach the “Percent Bridge” (Fraction ↔ Decimal ↔ Percent)
Percent becomes much easier when students see it as part of a triangle:
fractions, decimals, and percents are three ways to say the same relationship.
The goal isn’t speed. The goal is flexibility.
Step 1: Anchor Percent to Friendly Fractions
Start with fractions students already recognize, then connect them to percents using meaning.
- 1/2 = 50/100 = 50%
- 1/4 = 25/100 = 25%
- 3/4 = 75/100 = 75%
- 1/10 = 10/100 = 10%
- 1/5 = 20/100 = 20%
Use the 10×10 grid from Method 1 to support this. Students can literally see 25 squares as 1/4 of 100 squares.
Step 2: Introduce “Move the Decimal” Only After It Makes Sense
The “move the decimal two places” rule works, but it can turn into a magic trick students can’t explain.
So connect it to the idea of dividing by 100:
Percent to decimal: 18% = 18 per 100 = 18 ÷ 100 = 0.18
Decimal to percent: 0.42 = 42 per 100 = 42%
Now “moving the decimal” is just a shortcut for scaling by 100, not a random dance move.
Step 3: Use Number Lines and Tape Diagrams for “Percent of a Number”
When students hit problems like “Find 30% of 250,” they often freeze because they think percent means “multiply by chaos.”
Show them a predictable strategy using benchmark percents:
- 10% of 250 is 25 (because 250 ÷ 10 = 25)
- 30% is 3 × 10%, so 3 × 25 = 75
This approach builds mental math and makes later proportional reasoning feel natural. It also helps students catch nonsense
answers (like saying 30% of 250 is 750nice confidence, wrong planet).
Practice That Builds Reasoning (Not Just Repetition)
Try a short “Which is bigger?” routine:
- Which is bigger: 0.6 or 60%? (Same value.)
- Which is bigger: 3/5 or 62%? (3/5 = 60%, so 62% is bigger.)
- Which is bigger: 0.08 or 8%? (Same value.)
Students explain using “per 100” language. The explanation matters more than the final number.
Method 3: Teach Percent Through Real Life (a.k.a. Percent in the Wild)
Percent is everywhere, so students should see it everywhere. The trick is to use contexts that are real enough to matter,
but simple enough to compute without turning your class into an accounting firm.
Step 1: Run a Discount Lab
Bring in grocery ads, online store screenshots (printed), or pretend menus. Give students a few items and a “sale” sign:
20% off, 30% off, 15% off.
Teach a clean, student-friendly approach:
- Find 10% (divide by 10).
- Scale up (20% is double 10%, 30% is triple 10%).
- For 15%, do 10% + 5% (and 5% is half of 10%).
Example: $48 hoodie, 25% off.
25% is 1/4, so discount is $48 ÷ 4 = $12. Sale price is $48 − $12 = $36.
Students love this because it feels like math that actually buys things.
Step 2: Tip, Tax, and “Is This a Good Deal?”
Tips and tax introduce multistep percent reasoning in a way that feels grown-up (which students appreciateeven if they’re
still emotionally attached to snack time).
Quick tip routine:
- 10% of the bill is easy.
- 15% is 10% + 5%.
- 20% is double 10%.
Then add estimation:
“If the bill is about $19.80, a 15% tip should be close to $3.”
Estimation keeps students from trusting a calculator that accidentally ate a digit.
Step 3: Percent as Data (Surveys, Sports, and Screens)
Percent shines in data and probability because it communicates “how much” in a way that’s easy to compare.
Try a simple class survey:
- Ask a question students care about (best snack, most-used app, favorite music genre).
- Collect counts.
- Convert to percents out of the class total.
- Make a quick bar graph or circle graph.
Now percent isn’t a worksheet skillit’s how we describe results.
Optional Extension: Percent Increase and Decrease
For older students, percent increase/decrease can be taught as a comparison, not a formula hunt:
“How much did it change compared to what we started with?”
Example: A price rises from $50 to $60.
Change is $10. Compare to the original ($50): 10 ÷ 50 = 0.2 = 20%.
It’s not magicjust relationship thinking.
Quick Checks: Are Students Understanding or Just Doing Tricks?
Use short prompts that force meaning:
- Explain: What does 35% mean in a sentence?
- Estimate: Is 18% of 60 closer to 6, 12, or 30? Why?
- Compare: Which is larger0.7 or 65%? Show reasoning.
- Model: Draw a picture for 125%.
- Reverse: 20% of a number is 14. What’s the number?
Common Misconceptions (and One-Liners That Help)
- “Percent means multiply.” → “Percent means out of 100. Sometimes we multiply to find it.”
- “Bigger percent always means bigger amount.” → “Only if the whole is the same.”
- “You can’t have more than 100%.” → “You can have more than 100 of something. Percent compares to 100.”
- “0.5 is 5%.” → “0.5 is half, so it’s 50%.”
Experience Notes From Real Classrooms (About )
Teachers who get the best results with percentages usually aren’t doing anything flashythey’re doing something
consistent. One common pattern is starting every percent unit with visuals (especially hundred grids) before ever
introducing a calculator. In practice, that looks like a few days where students shade, count, estimate, and argue
politely about whether 62% “feels closer to 50% or 75%.” That arguing is gold: it’s students building number sense
instead of collecting formulas like trading cards.
Another classroom lesson that comes up again and again is that benchmark percents beat “memorize-the-steps” almost every
time. When students know 10%, 25%, and 50% cold, they can compute a surprising amount of real-world percent problems
without fear. A teacher might say, “Find 15%,” and students instantly think, “That’s 10% plus half of 10%.” They’re not
just calculatingthey’re reasoning. The confidence bump is real, and it changes the vibe in the room from “math is a trap”
to “math is a puzzle I can solve.”
Real-life contexts also tend to work best when they’re student-owned. Discounts are a classic, but the hook matters.
Some groups light up for shopping ads; others couldn’t care less. In those cases, teachers often switch to things students
track naturally: phone storage used (e.g., “Your phone says 80% fullwhat does that mean?”), game stats (win percentage),
or class surveys. A simple “snack poll” can do more for percent understanding than ten pages of isolated drills, because
the numbers come from their world. Students stop asking “When will we use this?” because they’re already using it.
In blended or tech-heavy classrooms, the most effective teachers use digital tools as a second representation, not
the first. For example, students might model percent with paper grids or tape diagrams, then check their thinking with an
interactive activity. This sequencing matters: the tech reinforces the concept instead of replacing it. Students still
need to talk through why 0.35 equals 35%, or why 120% needs a second grid. The best “tech moment” is when a student says,
“Oh, the model matches what I pictured,” not “The computer said so, so I guess it’s true.”
Finally, one of the most useful teaching moves is making error analysis normal. Instead of treating mistakes like sirens,
teachers put two student answers on the board (one correct, one common misconception) and ask, “Which one is reasonable
and why?” When students learn to sanity-checklike noticing that 30% of 250 can’t be bigger than 250they gain control.
And when students feel in control, percentages stop being scary and start being… dare we say… kind of satisfying.
If you keep one takeaway, keep this: teach percent as a meaning (“out of 100”), practice it with strong benchmarks, and
bring it to life with contexts students recognize. The procedures will follow. The understanding will stick. And your
students might even catch themselves using percent correctly in the wildat which point you are legally allowed to do a
small victory dance behind your desk.