Table of Contents >> Show >> Hide
- What Is Uncertainty in Measurement?
- Way 1: Calculate Uncertainty from Instrument Resolution
- Way 2: Calculate Uncertainty from Repeated Measurements
- Way 3: Calculate Uncertainty by Propagation
- Common Mistakes When Calculating Uncertainty
- Practical Experience: What Calculating Uncertainty Teaches You
- Conclusion
Uncertainty sounds like something you feel while choosing a lunch order from a menu with 87 options. But in science, engineering, statistics, manufacturing, medicine, and even everyday measurement, uncertainty has a much more useful meaning: it tells us how much confidence we should place in a measured or calculated value.
When you write “12.4 cm,” you are not really saying the object is exactly 12.400000000 cm long forever and ever, sealed by the measurement gods. You are saying your best estimate is 12.4 cm based on your tool, method, skill, conditions, and data. The uncertainty explains the wiggle room around that estimate.
Learning how to calculate uncertainty helps you avoid pretending that a measurement is more precise than it really is. It also helps you compare results, report data correctly, judge experiments, improve quality control, and make smarter decisions. In this guide, we will break down 3 ways to calculate uncertainty: using instrument resolution, using repeated measurements, and using uncertainty propagation for calculated results.
What Is Uncertainty in Measurement?
Uncertainty in measurement is the estimated range around a measured value within which the true value is reasonably expected to lie. It does not mean the measurement is “wrong.” It means every measurement has limits.
A result is usually written like this:
measured value ± uncertainty
For example:
Length = 25.6 cm ± 0.1 cm
This means 25.6 cm is the best estimate, and the measurement uncertainty is 0.1 cm. In plain English: “I measured it as 25.6 cm, but do not challenge me to a courtroom drama over the last tenth of a centimeter.”
Absolute, Relative, and Percent Uncertainty
Before calculating uncertainty, it helps to know the three most common ways it is reported.
Absolute uncertainty is written in the same unit as the measurement. If a mass is 50.0 g ± 0.2 g, the absolute uncertainty is 0.2 g.
Relative uncertainty compares the uncertainty with the measured value:
relative uncertainty = absolute uncertainty ÷ measured value
Percent uncertainty is relative uncertainty multiplied by 100:
percent uncertainty = (absolute uncertainty ÷ measured value) × 100%
Example:
If a pencil is measured as 18.0 cm ± 0.1 cm:
relative uncertainty = 0.1 ÷ 18.0 = 0.0056
percent uncertainty = 0.56%
This tells you the uncertainty is small compared with the measurement itself, which is good news for anyone emotionally invested in pencil accuracy.
Way 1: Calculate Uncertainty from Instrument Resolution
The simplest way to estimate uncertainty is to look at the measuring tool. This method is common when you take a single measurement and do not have repeated trials. It is often used in classrooms, labs, workshops, and quick field measurements.
Every instrument has a smallest readable division. A ruler might show millimeters. A digital scale might show 0.01 g. A thermometer might display tenths of a degree. The instrument cannot reliably tell you much more than its resolution allows.
Formula for Instrument Uncertainty
For many analog tools, a common rule is:
uncertainty = ± half of the smallest division
If a ruler has marks every 1 mm, the uncertainty may be estimated as:
± 0.5 mm
For many digital tools, the uncertainty is often estimated as:
± 1 unit of the last displayed digit
If a digital scale reads to 0.01 g, a simple uncertainty estimate may be:
± 0.01 g
However, always check the manufacturer’s specification when accuracy matters. Some instruments have calibration certificates or stated tolerances that are more reliable than a simple resolution rule.
Example: Measuring a Table with a Ruler
Suppose you measure the length of a table and get:
Length = 152.4 cm
Your ruler has marks every 0.1 cm. Using half the smallest division:
uncertainty = ± 0.05 cm
So you report:
Length = 152.4 cm ± 0.05 cm
Now calculate percent uncertainty:
percent uncertainty = (0.05 ÷ 152.4) × 100% = 0.033%
That is a very small percent uncertainty, meaning the ruler is precise enough for this measurement. If you were building a spacecraft, you might want more detail. If you were buying a tablecloth, you are probably fine.
When This Method Works Best
Use instrument-resolution uncertainty when you have only one measurement, when the tool is the biggest limitation, or when the measurement is straightforward and repeat trials are unnecessary. It works well for simple lengths, masses, volumes, temperatures, and times.
But there is a catch. Instrument uncertainty does not capture every possible source of error. A person may read the ruler at an angle. A scale may be poorly calibrated. A thermometer may need time to stabilize. The object itself may change shape, temperature, or position. Measurement uncertainty is not just about the tool; it is also about the whole measurement process.
Way 2: Calculate Uncertainty from Repeated Measurements
If you can measure something several times, you can use statistics to estimate uncertainty. This is one of the most reliable and widely used approaches because it uses actual data instead of relying only on the instrument label.
Repeated measurements reveal spread. If every reading is nearly identical, the uncertainty is small. If the readings jump around like popcorn in a hot pan, the uncertainty is larger.
Step 1: Calculate the Mean
The mean, or average, is your best estimate of the measured value:
mean = sum of measurements ÷ number of measurements
Suppose you measure the same object five times and get these values:
10.2 cm, 10.3 cm, 10.1 cm, 10.2 cm, 10.4 cm
The mean is:
(10.2 + 10.3 + 10.1 + 10.2 + 10.4) ÷ 5 = 10.24 cm
Step 2: Calculate the Sample Standard Deviation
The standard deviation describes how spread out the measurements are. A small standard deviation means the measurements are close together. A large standard deviation means they vary more.
For repeated measurements, sample standard deviation is commonly used because you are usually working with a sample of possible measurements, not every measurement that could ever be taken in the known universe. That would take a while.
The sample standard deviation formula is:
s = square root of [sum of (each measurement − mean)² ÷ (n − 1)]
Using the five measurements above, the sample standard deviation is about:
s = 0.11 cm
This tells you the typical spread of individual measurements is about 0.11 cm.
Step 3: Calculate the Standard Error of the Mean
If you want the uncertainty in the average value, use the standard error of the mean:
standard error = s ÷ √n
In this example:
standard error = 0.11 ÷ √5 = 0.049 cm
Rounded appropriately, the result is:
Length = 10.24 cm ± 0.05 cm
The more repeated measurements you take, the smaller the standard error usually becomes, assuming the measurements are independent and the process is stable. That is why scientists love repeat trials. They are not being dramatic; they are reducing uncertainty.
Standard Deviation vs. Standard Error
Standard deviation and standard error are related, but they are not the same thing.
Standard deviation describes the spread of individual measurements.
Standard error describes the uncertainty in the mean of those measurements.
If your goal is to describe how much individual readings vary, report standard deviation. If your goal is to report the uncertainty of the average result, report standard error.
Way 3: Calculate Uncertainty by Propagation
Many final results are not measured directly. They are calculated from other measurements. For example, density is calculated from mass and volume. Speed is calculated from distance and time. Area is calculated from length and width.
When measured values are used in a formula, their uncertainties travel with them. This is called propagation of uncertainty, also known as propagation of error.
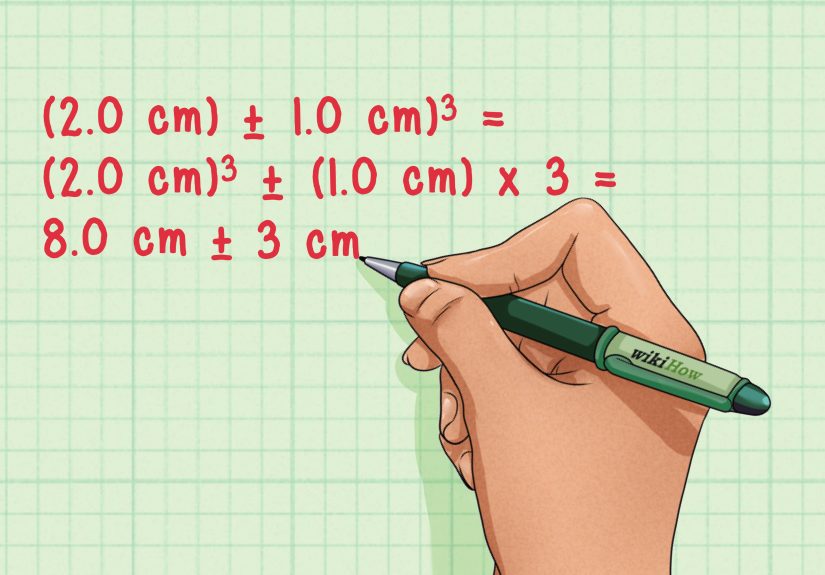
For Addition and Subtraction
When adding or subtracting independent measurements, combine absolute uncertainties using the root-sum-square method:
combined uncertainty = √(u1² + u2² + u3² + …)
Example:
You measure two lengths:
A = 12.0 cm ± 0.2 cm
B = 8.0 cm ± 0.1 cm
Total length:
A + B = 20.0 cm
Combined uncertainty:
√(0.2² + 0.1²) = √(0.04 + 0.01) = √0.05 = 0.22 cm
Report:
Total length = 20.0 cm ± 0.22 cm
For Multiplication and Division
When multiplying or dividing independent measurements, combine relative uncertainties:
relative uncertainty in result = √[(uA/A)² + (uB/B)² + …]
Example:
You calculate speed using distance divided by time:
distance = 100.0 m ± 0.5 m
time = 9.80 s ± 0.05 s
Speed:
speed = 100.0 ÷ 9.80 = 10.20 m/s
Relative uncertainty in distance:
0.5 ÷ 100.0 = 0.005
Relative uncertainty in time:
0.05 ÷ 9.80 = 0.0051
Combined relative uncertainty:
√(0.005² + 0.0051²) = 0.0071
Absolute uncertainty in speed:
10.20 × 0.0071 = 0.07 m/s
Report:
speed = 10.20 m/s ± 0.07 m/s
For Expanded Uncertainty
In professional laboratories, uncertainty is often reported as expanded uncertainty. Expanded uncertainty uses a coverage factor, commonly represented by k, to create a wider interval around the result.
The formula is:
U = k × uc
Here, U is expanded uncertainty, k is the coverage factor, and uc is combined standard uncertainty.
A common choice is k = 2, which is often used to represent an interval with approximately 95% coverage when assumptions are appropriate. For example:
combined standard uncertainty = 0.04 g
expanded uncertainty = 2 × 0.04 g = 0.08 g
Report:
mass = 25.60 g ± 0.08 g, k = 2
This is especially useful in calibration, manufacturing, regulatory testing, and quality assurance, where people need a clear uncertainty interval for decision-making.
Common Mistakes When Calculating Uncertainty
Mistake 1: Reporting Too Many Digits
If your uncertainty is ± 0.2 cm, reporting a result as 14.837492 cm is like wearing a tuxedo to mow the lawn. It looks fancy, but it does not match the situation.
A good rule is to round the uncertainty to one or two significant figures and round the measured value to the same decimal place as the uncertainty.
Instead of:
14.837492 cm ± 0.2 cm
Write:
14.8 cm ± 0.2 cm
Mistake 2: Confusing Accuracy with Precision
Precision means repeated measurements are close to each other. Accuracy means the measurement is close to the true value. A broken scale can be precise but inaccurate if it gives the same wrong reading every time.
Uncertainty helps describe precision, but calibration and bias must also be considered when accuracy matters.
Mistake 3: Ignoring Systematic Effects
Repeated measurements can reveal random variation, but they may not reveal systematic problems. If your ruler is stretched, your thermometer is offset, or your stopwatch operator has the reaction time of a sleepy turtle, repeated trials alone may not fix the issue.
Good uncertainty analysis considers both statistical evidence and non-statistical sources such as calibration data, manufacturer specifications, environmental conditions, and measurement technique.
Practical Experience: What Calculating Uncertainty Teaches You
The first time you calculate uncertainty, it may feel like the measurement is getting worse. You start with a nice clean number, and then suddenly you have to attach “± something” to it. But the truth is the opposite: adding uncertainty makes the result more honest, more useful, and more professional.
In real lab work, one of the biggest lessons is that measurement is rarely as simple as reading a number from a screen. A digital balance may look confident, but a small draft from an air conditioner can make the last digit dance. A ruler may seem basic, but reading it from a slight angle can shift the value. A stopwatch may record hundredths of a second, but your thumb probably does not operate with Olympic-level consistency. Calculating uncertainty forces you to notice these details.
Another useful experience is learning that more data usually helps, but only when the data is collected well. Taking ten rushed measurements with sloppy technique is not automatically better than taking five careful ones. Repetition reduces random uncertainty, but it does not magically repair a bad setup. If the instrument is miscalibrated, if the method is biased, or if the sample changes during measurement, the average may become very precise and still be wrong. That is a humbling little math goblin hiding inside many experiments.
Uncertainty also changes how you compare results. Suppose one group reports a length of 50.2 cm ± 0.1 cm, and another reports 50.4 cm ± 0.1 cm. Those results barely overlap, so the difference may matter. But if another measurement is 50.4 cm ± 0.5 cm, the story changes. The larger uncertainty means the apparent difference may not be meaningful. This is why uncertainty is so important in science and engineering: it prevents overreacting to tiny differences that the measurement process cannot truly support.
In everyday life, the same thinking appears more often than people realize. Cooking temperatures vary. Bathroom scales fluctuate. Fitness trackers estimate calories with hidden assumptions. Weather forecasts give probabilities because the atmosphere refuses to behave like a spreadsheet. Even delivery times come with uncertainty, although some delivery apps prefer to express it emotionally: “arriving soon,” which is not a unit but certainly feels like one.
The most valuable habit is asking, “How do I know this number?” That question leads naturally to better measurements. You check the tool. You repeat the reading. You calculate spread. You combine uncertainties when using formulas. You round the final answer sensibly. You stop pretending the last digit is carved into stone tablets.
In professional settings, this habit builds trust. A lab report with uncertainty shows that the writer understands measurement limits. A quality-control result with uncertainty helps decide whether a product meets specifications. An engineering calculation with propagated uncertainty can reveal which input needs better measurement. Sometimes the uncertainty points directly to the weakest part of the process, which is extremely useful. It is like the number quietly saying, “Hey, maybe buy a better thermometer before blaming the laws of physics.”
Ultimately, calculating uncertainty is not about making numbers complicated. It is about making numbers believable. A value without uncertainty may look neat, but a value with uncertainty tells the fuller story. It says what was measured, how confidently it was measured, and how much room remains for doubt. That is not weakness. That is good measurement manners.
Conclusion
Uncertainty is not the enemy of good measurement; it is part of good measurement. Whether you estimate it from instrument resolution, calculate it from repeated measurements, or propagate it through formulas, uncertainty gives your numbers context.
The three main ways to calculate uncertainty are simple once you understand the purpose of each method. Use instrument resolution for single measurements, repeated measurements for statistical uncertainty, and propagation rules when your final answer depends on multiple measured values. For professional results, combined and expanded uncertainty may also be needed.
The next time you see a number, do not just ask, “What is the value?” Ask, “How certain are we?” That small question can turn a plain measurement into meaningful information.